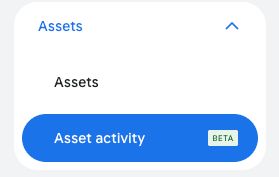
You find it under Assets > Asset activity. The insights refresh every week and you can filter by Featured, Asset performance, Asset diversity, Competitor performance and Industry trends.
The cards show things like a 12% higher clickthrough rate for repair-specific headlines, or a tip to add health safety headlines when an asset group lacks headline diversity.
You also get weekly activity for the past 90 days: assets added or removed and campaigns with active assets. Some highlights are generated with Google AI and carry a disclaimer.
Spotted by CJ Lopez , via Hana Kobzová.