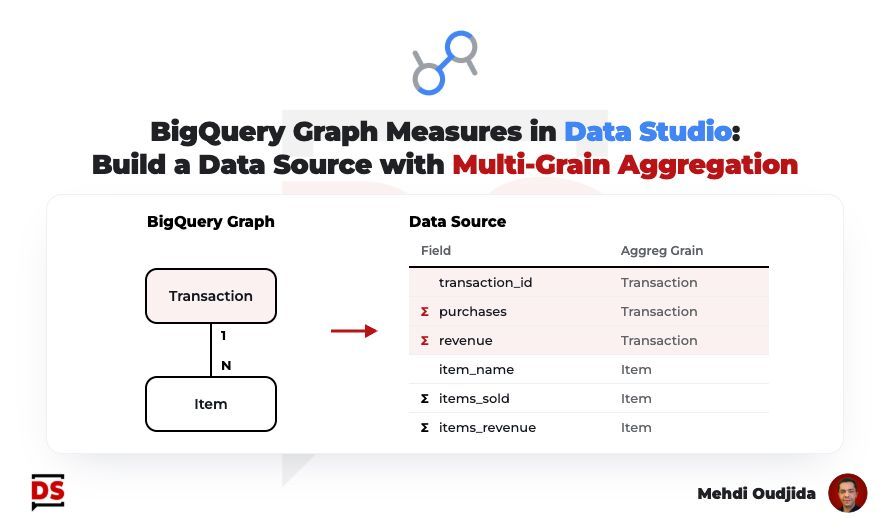
Before, mixing orders and items meant one table per grain, a blend per chart or a custom query per question. Every new chart risked counting an order twice.
Now you declare once in BigQuery at which grain each metric is aggregated, and every Data Studio chart follows it.
Two releases make it work:
October 22: the BigQuery connector in Data Studio can connect to a BigQuery Graph. Its measures come in as metrics, and their aggregation can't be changed in the report.
November 10: graph measures in BigQuery are generally available. A measure is locked to the key of its node, so it stays correct even when a join duplicates rows.
My tip: if your reports mix grains, check which blends and custom queries a graph with measures could replace.
Spotted by Mehdi Oudjida.