Small but useful update in Looker Studio
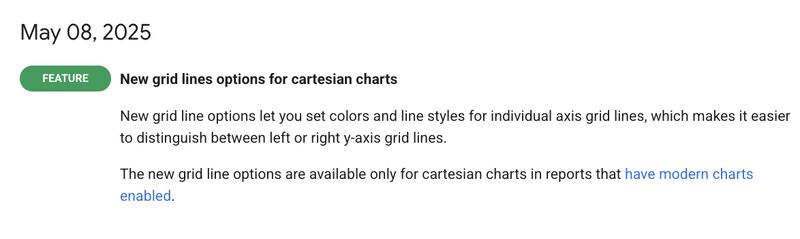
You can now customize grid lines per axis in cartesian charts (if modern charts are enabled). – Set different colors or line styles for the left and right y-axes.– Super helpful when you’re plotting multiple metrics with dual axes. Makes your reports easier to read and cleaner to present.
Small but useful update in Looker Studio Read More »