More information on [GA4] Benchmarking Overview
Benchmarks are key metrics that enable you to compare your business’s performance against other businesses in your industry.
Google Analytics provides these benchmarks through peer groups—cohorts of similar businesses determined by factors like industry vertical and other relevant details.
Key Features
Daily Updates: Benchmarks are refreshed every 24 hours to provide the most current data.
Eligibility Requirements: To access benchmarking data, your Google Analytics property must have the “Modeling contributions & business insights” setting enabled. Additionally, your property must generate sufficient user data to be included in a peer group.
Data Protection Your benchmarking data is encrypted and protected, ensuring privacy and aggregation. There are also thresholds to guarantee that a minimum number of properties are included before benchmarks are available to a peer group.
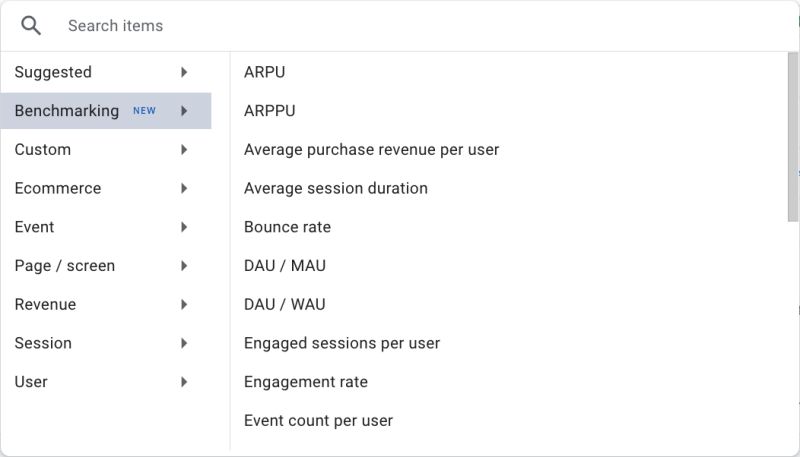
Accessing Benchmarking Metrics To view benchmarking data:
Select the desired metric in the overview card on the Home page.
Expand the Benchmarking category.
Choose from a variety of metrics, such as Acquisition, Engagement, Retention, and Monetization.
Using Benchmarking Data When benchmarking data is activated, you’ll see:
Your property’s trendline
The median of your peer group
The range within your peer group (shaded area)
Benchmarking comparisons are available within the 25th to 75th percentile to help you make informed decisions based on your performance relative to your peers.
Changing Your Peer Group You can change your peer group to ensure more accurate comparisons.
Peer groups are categorized based on industry characteristics, such as Shopping > Apparel or Travel & Transportation.
Example Scenarios
Acquisition: If your ‘New User Rate’ is below the 25th percentile, consider boosting user acquisition strategies.
Engagement: A high ‘Average Engagement Time per Session’ could be leveraged by enhancing conversion strategies.
Retention: A high ‘Bounce Rate’ may indicate a need for better user experience and content accessibility.
Monetization: Low ‘ARPU’ suggests exploring strategies like upselling or personalized offers.
Conclusion Benchmarking data in GA4 offers actionable insights by comparing your performance with industry peers, helping you identify strengths and areas for improvement to achieve your business goals.