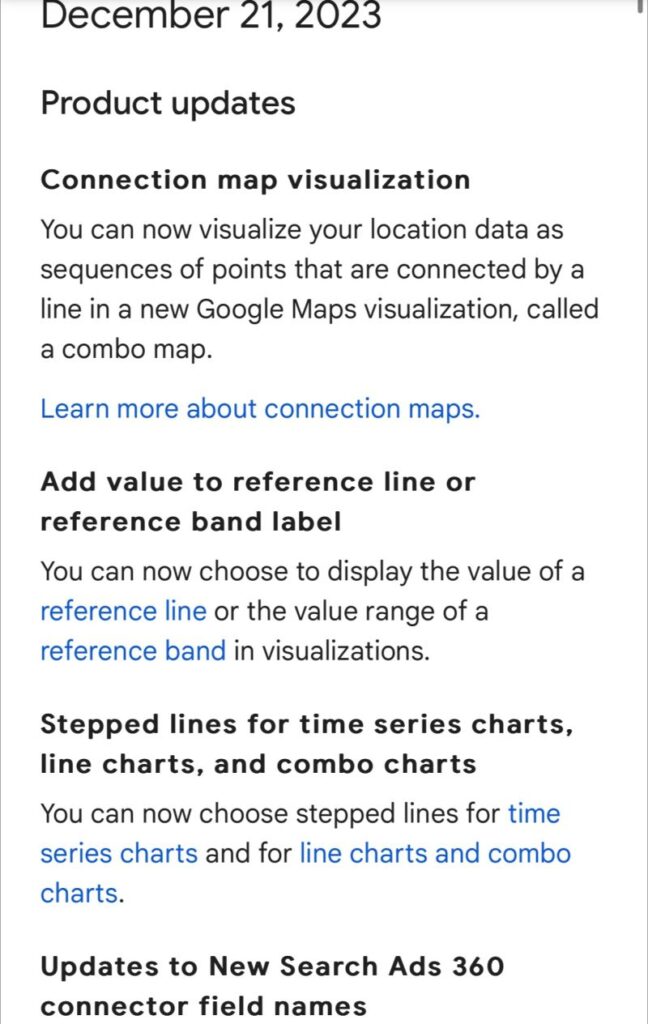
Connection map visualization:
You can now visualize location data as sequences of points that are connected by a line in a new Maps visualization.
Add value to reference line or reference band label:
You can now choose to display the value of a reference line or the value range of a reference band in visualizations.
Stepped lines for time series charts, line charts, and combo charts:
You can now select stepped lines for time series charts and for line charts and combo charts.
Updates New Search Ads 360 connector field names:
The display names for several fields in the New Search Ads 360 data source have been updated.
Existing connections to the New Search Ads 360 data source won’t be affected.
For more information read: https://lnkd.in/errjn6uN
